Platform for Interdisciplinary Inquiry – GIS
Putting ‘place,’ ‘space,’ and humanity into a shared frame of reference for the MEDITERRANEAN TRIVIUM . Contributed by C. Siddoway, Colorado College.
The Mediterranean [ Italy ] has at least two faces. In the first place, it is composed of a series of compact, mountainous peninsulas, interrupted by vital plains. Alternating ridges and valleys exist on land and continue beneath the Sea. Second, between these miniature continents lie vast, complicated, and fragmented stretches of sea, for the Mediterranean is not so much a single body as a ‘complex of seas.’ Peninsulas and seas: these are the two kinds of environment we shall be considering… to establish the general conditions of human life. Paraphrased from Braudel, Part I, Ch. 1
Many of our colleges are situated in the USA and most courses are not international, but there is absolutely no reason not to ‘travel’ — via web map services — to the sites for international study that we use in campus-based courses !
The purpose of this activity is to explore uses of geospatial software for academic inquiry, using examples from diverse disciplinary perspectives. Using GIS, we will have the possibility to examine the region of the Mediterranean from a variety of scales (e.g. the Sea, the peninsula of Italy, the Appenines, the Arno), and from diverse ‘cultural’ (inter-disciplinary) perspectives. First-time users will gain direct experience with GIS as a powerful investigation tool and data management resource that is undergoing rapid expansion as a platform for interdisciplinary research.
The first activity involves close observation and inquiry using the interactive digital elevation model for Italy, and the second makes use of GoogleEarth. The third part of the exercise uses a free software application developed at Lamont Doherty Earth Observatory, long available to PC users as GeoMapApp and newly available to Mac users as Virtual Ocean.
All software applications are free and can be downloaded from the internet. All three make use of online databases that must be accessed via the internet (global databases too large to be loaded on a laptop computer!), so you must be on line to use these resources.
A further aim for the lab is to instill habits of primary observation, pattern recognition for development of diagnostic criteria, critical thinking, question formulation and question refinement, through use of quantitative tools in GIS that offer a rapid means of experimentation and data-gathering. Applications are not limited to maps!
FREE ACCESS, Interactive GIS Software:
GoogleEarth http://www.google.com/earth/index.html
Digital Elevation Model of Italy http://labtel2.rm.ingv.it/shaded/
GeoMapApp http://www.geomapapp.org/
Java http://java.com/en/download/
This exercise is adapted from a geospatial inquiry module for an interdisciplinary course at Colorado College, Catastrophe and Continuum, intended for 1st to 3rd year students or others who do not have GIS experience. It serves as an introduction to GIS for first-time users so they can explore and experiment with GIS, the powerful investigation tool and data management resource that is used across all liberal arts disciplines. This GIS module may lend insight into what can be achieved using more specialized software such as ESRI ArcGIS™, the leading GIS package that requires a user license.
The Geospatial Framework of sites in the Mediterranean Trivium
I. Arno and Appenines
During SAIL 2013, we have recognized that several disciplines share an emphasis on primary observation. This exercise asks that observational abilities be applied to a regional scale landscape, in order to obtain information about the larger spatial context of an urban center.
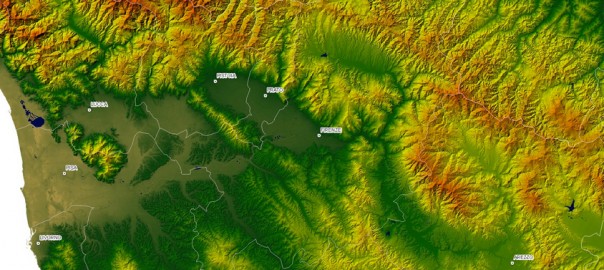
1/ Braudel’s view of Mediterranean ecology emphasizes the complex patterns of mountains and basins (‘seas’) that define the Mediterranean and create localized ecosystems that frame human existence. The sub-region in the map below serves as an example of this. The map is a digital elevation model, or DEM, with a line overlay for rivers, in blue. Use it to acquaint yourself with the Arno River, from the headwaters to the sea. Record 4 or 5 observations of the Arno River catchment (catchment: the river and tributaries, plus the intervening terrain).
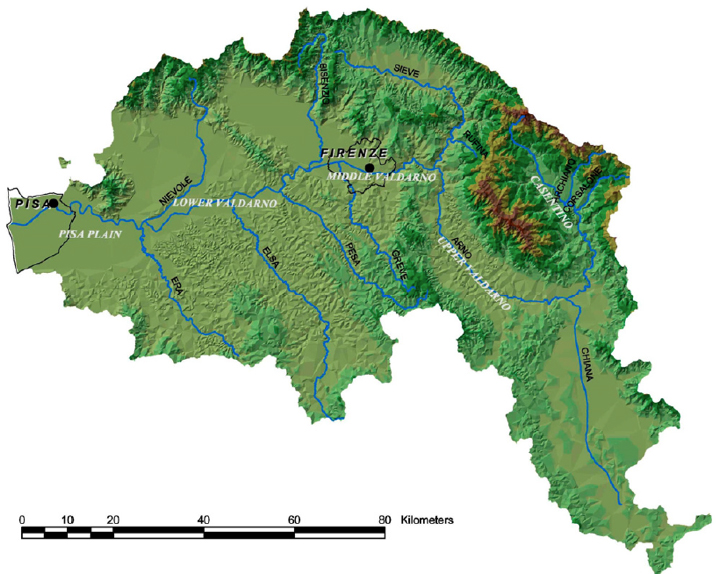
Figure 1: Digital elevation model and drainage network for the Arno River, Tuscany. Uniform areas of light green color are lowlands. Rugged areas are mountains, with the red-brown color on highest elevations. Credit: Caporali et al. 2005, GGA v. 1.
After getting acquainted with the Arno River ‘catchment’ using the map above, open and explore the interactive digital topography map (DEM) of Italy, online at http://tinitaly.pi.ingv.it/ (Tarquini et al. 2007*), together with the paired images on the next page. In the upper right hand corner of the frame, it offers a group of simple tools that can be used to zoom in and out, to pan (hand tool), and to measure with a ‘ruler.’ On the left are some selections of basic geographic data layers that can be ‘turned on’ or off, thus the interactive map is a GIS. Note: the white lines on the interactive map are the boundaries of provinces (not rivers or roads). Use observational skills and critical thinking to develop ideas that relate landscape/landforms to earth processes !
2/ Spend some time exploring the interactive Italy GIS by zooming in using the (+) tool, then panning (hand tool) across the SAIL Trivium sites in Italy.
• The position of Rome in relation to Colli Albani volcanoes, Sabatini volcanic fields, and Tiber
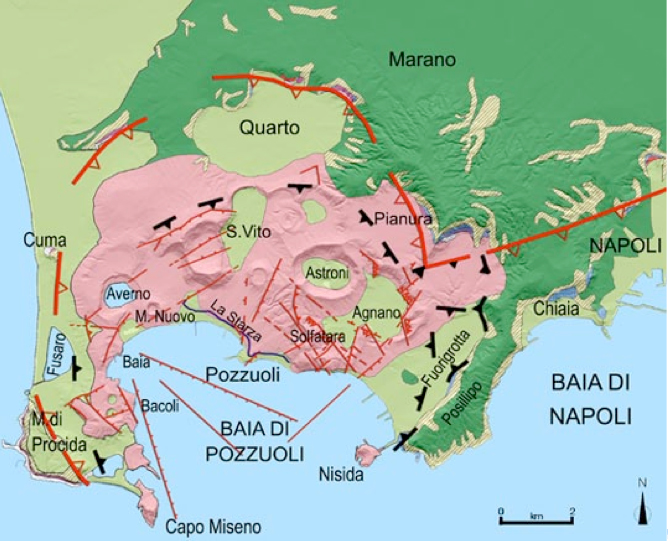
• The Bay of Naples flanked by Somma-Vesuvius to east and Campi Fleigri volcanoes to north. What ‘textural’ evidence is there for the limits to the volcanoes? Can you make out features suggestive of changes in position of shoreline?
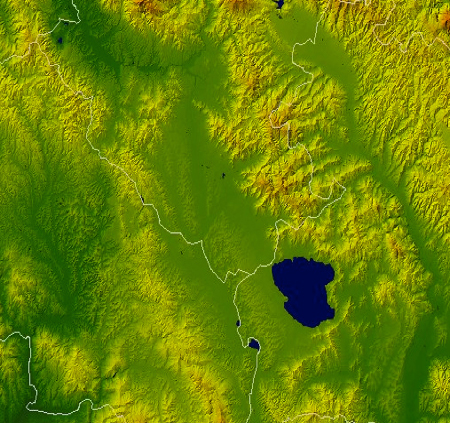
• Locate Orvieto, visited yesterday, to understand its spatial relationship to the big Bolsena volcanic center (occupied by a lake), that erupted to produce the tuff forming the Alfina Plateau and Orvieto’s pozzolana.
• Systematic patterns in the Appenines and in western Italy that might be attributable to active geological faults.
• Getting back to the Arno, zoom in, zoom out, and pan to trace its length from headwaters to its mouth at Pisa, and the nearby Padule di Fucecchio that we will visit tomorrow. The ‘hairpin’ shape of the upper reach of the Arno, in respect to the dominant trend of the Appenine chains, is most interesting. Also, the sources of the Tiber and the Arno are very close together. Can you make them out by ‘reading’ the topography?
• What questions come to mind, and what realizations do you reach, through access to this terrain model?
2/ Arno and beyond:
To quickly get a sense of spatial relationships, use the interactive Italy DEM, and the “ruler” tool, measure the following. (Do this quickly! )
| Distance along River between Florence and Pisa | ||
| Spacing between tributaries south of the Arno | ||
| Length and width of Val di Chiana | ||
| Distance from Pisa to the coast | ||
| Width of Mt Vesuvius | ||
| Width of Somma volcano | ||
| Distance from Rome to the coast | ||
| Distance from Orvieto to Lake Bolseno | ||
| Spacing between the volcanic centers of mainland Italy |
In Part II of this activity, we’ll use Google Earth to examine the setting of sites of cultural centers and earth resources within the physiographic context.
3/ Next apply your own powers of primary observation to this detailed historic map (historic, indeed! It is the work of Leonardo da Vinci!) and the modern DEM.
Arno River Arno River
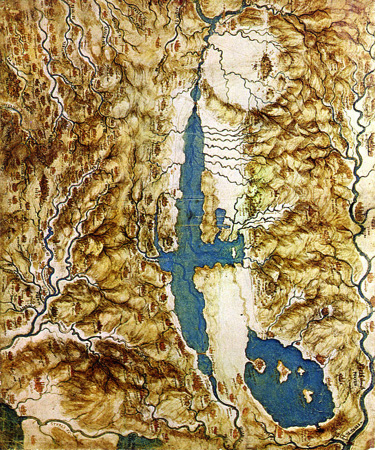
 Chiana outlet Tiber R. Chiana outlet Tiber R.
3 / Val di Chiana is a generally north-south oriented broad valley that lies west of Orvieto. It has stream outlets that flow both north to the Arno and south in to the Tiber; thus the Val is the site of a drainage divide.
a) Using the static images above (and the Italy DEM if you wish), identify physiographic features that are rendered in both images. (Doing this, it is hard not to marvel at Leonardo’s detailed depiction!) Comparing the two, list four or five ways that the Arno River catchment changed in ~500 years.
b) Does the 16th siècle drawing by Leonardo da Vinci accurately represent the scale and proportion of landforms, based on your comparison with the DEM? For what purpose was Leonardo’s diagrammatic map made?
c) Drawing upon your own or your colleagues’ expertise, imagine how Leonardo was able to conceptualize the landscape from a vantage point that is above the plane of the Earth. What does the drawing suggest about his / the culture’s perception of landscape? What does the interactive DEM and our use of this tool convey about our perception of and relationship to landscape, today?
INTERDISCIPLINARY CURRICULUM POTENTIAL: GIS was created as a common platform for study of diverse types of information that occupies the same space. What information would your team like to examine within the spatial context? Be thinking about the rich potential for creating a common framework for interdisciplinary inquiry in GIS!
For the purpose of this course, such exploration might best be undertaken in GoogleEarth (Part II) or GeoMapApp (Part III).
II. GoogleEarth Exploration
Upload and open Google Earth, then navigate to the Mediterranean region. There are various ways to do that. GoogleEarth provides a resource that explains the interactive tools.
1/ Having acquainted yourself with the Arno River catchment from the standpoint of elevation and landforms, now go to the free GIS software application, GoogleEarth, to examine the distribution of tributaries and wetlands, position of engineered structures, extent of agricultural and urban development, location and number of quarries, and sites of industry. The examination of those features may reveal spatial associations that have a bearing on Arno River dynamics. Of potentially great value, too, the GoogleEarth GIS offers access to measurement and mapping tools that we can use to gather geographical data. These tools (accessed with menu buttons along the top bar) are: ruler tool, profile tool, polygon tool. Try them out to determine:
• How long is the Arno River? Use line tool to “click out”/draw the path from headwaters to sea. Double-click to terminate the line. The menu box will show the total distance.
• Right click on the line to see an elevation profile. How much elevation change is there between the headwaters and mouth of the Arno River?
• How much area is devoted to agriculture, industry, and quarrying, and in what proximity to the River?
2/ GoogleEarth – scale it up
The Mediterranean Sea corresponds to the location of a tectonic suture: a region in the Earth’s crust where continent-continent collision is underway. The process of collision can be understood within the contemporary framework for understanding the dynamic (catastrophe-prone) planet Earth, Plate Tectonic Theory. One tenet of plate tectonics is the organization of Earth’s lithosphere (solid outer portion of planet Earth) into large discrete segments, or plates, that are in motion due to circulation of material that makes up the deep portions of Earth. A second tenet is that oceanic and continental lithosphere have different physical properties, due to contrasting chemical makeup and density. Dense oceanic crust can be ‘recycled,’ or subducted, whereas continental crust, in most instances, cannot be subducted.
Activity: Use a GIS layer in the form of a GoogleEarth kmz (kml) resource to obtain a map of global tectonic plate boundaries, for analysis: Obtain and load this GIS layer in GoogleEarth. Ask for help if you need it! (The colored text in this paragraph is a LINK.)
Sub-activity : Many, many, many additional layers of information are available and being developed for analysis in GoogleEarth or other GIS applications. To hunt down resources in your discipline, for use in GoogleEarth, use a web browser to search for a class of information in “kml” format. KML files are GIS data layers that can be uploaded to view in GoogleEarth or GoogleMaps; for example, the geological map of the province of Siena.
3a/ VISIT AN ITALIAN CITY and its ‘natural’ surroundings in GoogleEarth, as a ‘virtual’ traveler. Acquaint yourself with the Zoom, Oblique Perspective, and Street View functions. The aim is to travel to Italy (virtually) in order to obtain direct visual acquaintance with cities and architecture, fluvial systems and ecosystems, and archeological/cultural treasures that are situated in Italy. (See next section for an example of a data-collection exercise.)
3b/ Alternatively, if you are tectonically or regionally inclined:
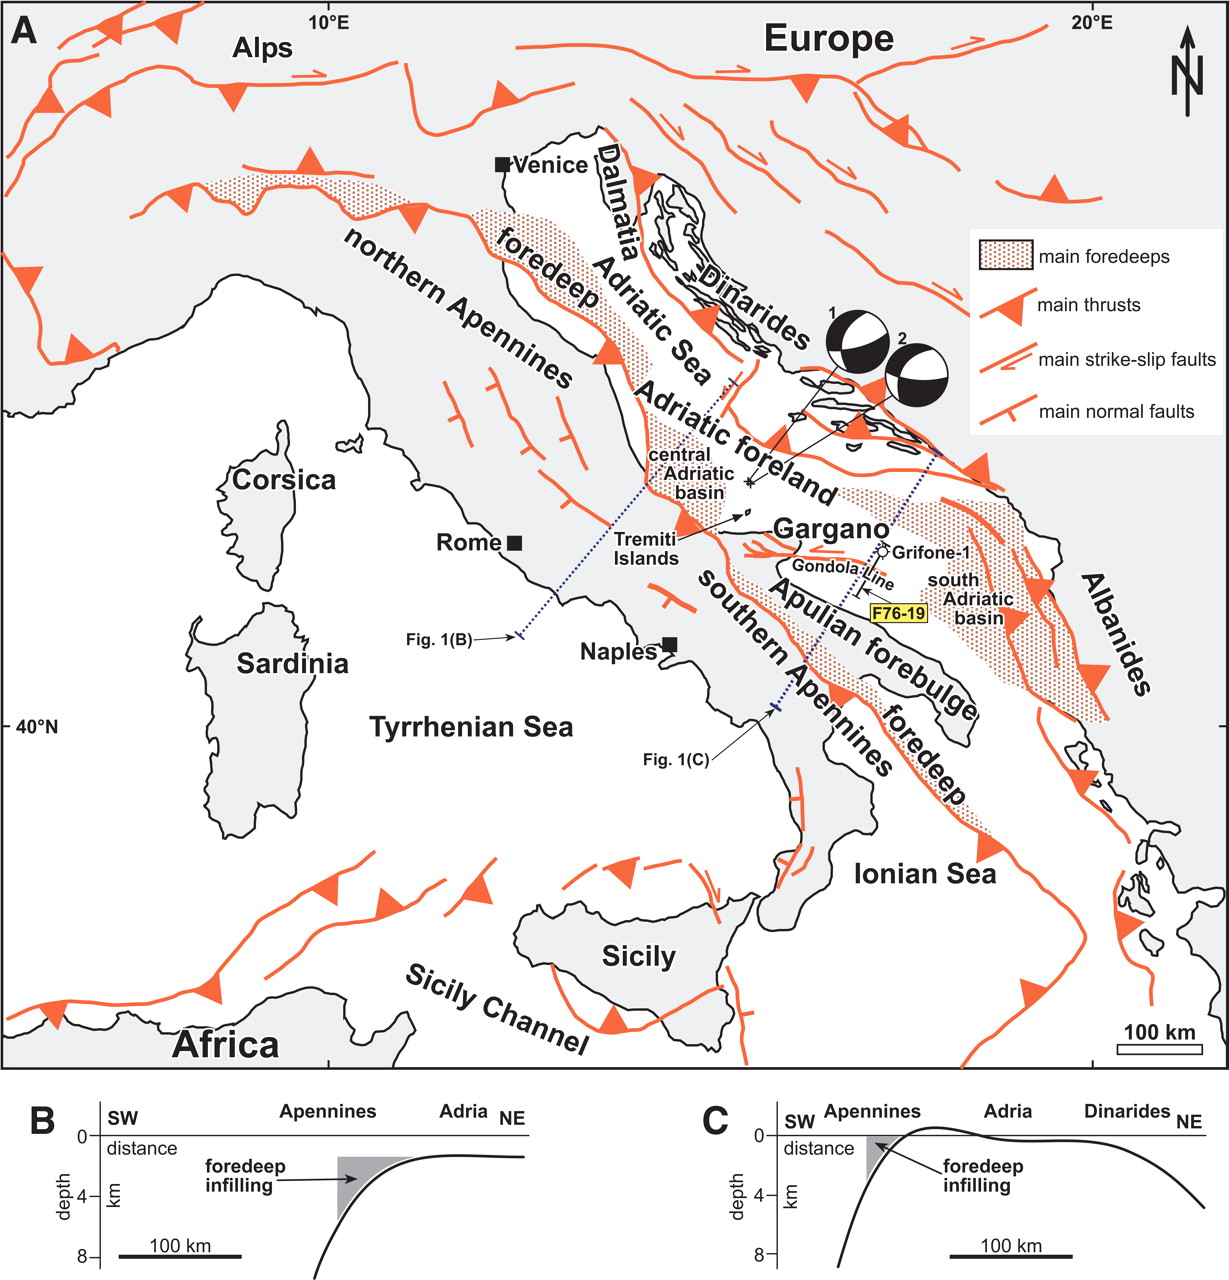
Gather observations of the shapes and patterns evident in the Appenine chain on land in Italy. Are there patterns that have a regular orientation or shape? What are the directions, and what are the shapes? How do these relate to Italy’s plate boundaries (see map, next page)?
“Revisit” the regions of Rome, Naples, and Florence (± Orvieto) to get a new view of terrain elements that we visited or admired from afar. Locate the Roman cities of Latium, Pompeii and Herculaneum within this context.
Next observe and describe the roughness and features evident in the bathymetry below sea level, using the + and – zoom tools to examine both large scale and small scale views. Are there regular geometrical shapes and areas of low or high topography? Is there any thing systematic about their distribution or extent? Use your observations to develop questions and/or possible explanations for the features that you observe.
2/ For a hands-on experience, for those who are enamored of volcanoes: Use Google Earth to return to the Bay of Naples, to Rome, and to other sites, to gather information on diagnostic characteristics of active volcanoes. Use GoogleEarth tools to make the following measurements (in meters or kms) and use those parameters to assess volcanic risk, based on the dimensions of the volcanoes:
| Volcano name | Height & elevation | Breadth | Area | Distance from coast | Distance from urban area | Other |
| Vesuvius | ||||||
| Somma | ||||||
| Colli Albani | ||||||
| Sabatini field | ||||||
| Campi dei Fleigri* | ||||||
| Etna | ||||||
| Stromboli |
4/ Conclude this section by locating ‘keynote markup language’ KML files that present DATA that is of interest to you, from the standpoint of your discipline, together with a layer of information that is of interest to one of your peers. KML resources are proliferating as GoogleEArth resources! To find some: Add “KML” to your web-search terms, and see what you find in your own region and own professional realm! Here is one example from the Italian demographic data / 2001 Census, that can be opened in Google Earth:
Exercise III. GeoMapApp for PC and Mac, from Lamont Doherty Earth Observatory of Columbia University. Access information:
To begin, obtain a current, secure version of Java that is needed for your computer to handle map datasets smoothly. Go to Java online, to download .
Next, open GeoMapApp, available from Lamont Doherty Earth Institute. The software uses global databases to render “virtual landscapes” of the continents and seafloor that may be used to transport students from a college campus into any part of the planet Earth. DEMs of seafloor bathymytry are constructed from/by the Marine Geoscience Data System at LDEO, at Columbia University.
Click on to select the Mercator projection (on left) that offers an equatorial view of the Earth’s tectonic plates. Orient yourself to the map and use the + zoom tool to draw a drag box over the Mediterranean, a complex “Suture Zone” that marks the Africa-Europe collision involving continental and oceanic crust. To help you understand the scale of the features in the view, add two of the overlays from the Overlays menu. Activate Overlays “Distance scale” and “Color Scale”.
Activity: Explore the Suture zone that is the Mediterranean
Braudel describes the Mediterranean as: “not a single entity but as a ‘complex of seas.’ Peninsulas and seas: these are the two kinds of environment … [that] establish the general conditions of human life.”
The distinct character of the Mediterranean subbasins has long been recognized, as is recorded in myth, epic poems, and with geographic nomenclature.
New understanding of topographic complexity that is characteristically Mediterranean (e.g. Braudel) can come from observations that span the continental regions and seafloors, together.
1/ Create, look at, and interpret the processes responsible for the shape(s) of profiles across three of the Mediterranean sub-basins. Orient your line of profile in order to capture the full bathymetric relief from deepest to shallowest depth, positioning the line at right angles to any elongate ridges or islands (such as Crete or Sardinia).
To do so, click on to select the Mercator projection (on left) for use, since it offers coverage of the Mediterranean region. Orient yourself to the map and use the + zoom tool to draw a drag box over Italy or the full Mediterranean Sea in order to get a closer look at the geographic character that is described by Braudel. To help you understand the scale of the features in the view, add two of the overlays from the Overlays menu. Activate Overlays “Distance scale” and “Color Scale”.
2/ Next, make bathymetric profiles. To do so, first click on the square action button that is 7th from left, to activate the profile menu (a new panel will open below the map), then on the 6th –from-left action button to activate the profile tool. In the lower panel, click on the “draw profile” selection button in lower right, then move the mouse into the map area, hold down, and draw a line of profile across the plate boundary on the map. (you may have to click the round “action button” below the make profile command button). A profile will draw in the lower panel! Leave the profile OPEN while you examine the features in both cross section and map view. Note that when you move the cursor along the profile, a location-dot shows on the map!
c. Describe what you see in the profile, according to the chart below. Is the profile is symmetrical or asymmetrical? Is it smooth or rugged? and give the observations you used to make the determination. Carry on to explain the significance of the features from the standpoint of plate boundary processes! Use the width and the seafloor age map to determine the spreading rate (see below).
In your description of the bathymetric profile, provide the depth of the deepest point and height of the highest point of the profile (high point might be above sea level, SL) and calculate the difference in elevation between the two for your representative profile. That value is called the topographic relief (or, for regions below sea level, the bathymetric relief).
d. Use the “Save” button in the profile window to save a jpg or png image of the profile you created. The image will save to the desktop of your computer. (Students would insert the images as figures in a writeup/ lab report, using the ‘Insert Picture From File’ menus in MSWord ).
Assignment: i) Describe bathymetric features in map view
ii) Describe the appearance of the bathymetric profile. Determine: what is the Depth of deepest point? what is the Height of the highest point?
If you wish to, you can SAVE the map window as an image file using the SNIP application on the PC or Grab tool on the Mac, then copy/paste or OPEN and insert the image within a word processing document.
3/ Examine and experiment with the GIS “layers” available in GeoMapApp in order to add at least ONE (preferably three or more) additional dataset to the map regions you are studying. For example, you can go to the Portals menu and select the seismicity “layer” to see a distribution of recent earthquakes and their magnitudes.
Even more alluring – GeoMapApp offers the possibility to add your own geospatial data layers for analysis. Use the functions within the software and the online resource pages to do this!
Resources and Readings:
- GoogleEarth Geospatial Resource: Free Download (Google Earth)
- GeoMapApp Geospatial Resource: Free Access (GeoMapApp)
- Tarquini S. et al., TINITALY/01: Digital Elevation Model of the Whole Italian Territory: Annals of Geophysics, 50 (2007): 407-425.
- Alvarez, W., The Mountains of St. Francis (Part IV). Norton Press, 2009, 288 pp. [Used Books: Amazon]
- Tewksbury B. (ed.), “Teaching Geologic Map Interpretation Using Google Earth”
- Cowie P. & Tucker T., “Landscape Evolution in Response to Active Tectonics: The Italian Apennines (accessed Feb. 2013)
- Armiero, Marco, A Rugged Nation: Mountains and the Making of Modern Italy, 2011. Epilogue, pp. 173-194. [on the Vajont disaster]